Determining Relationships Using
BLAST
What is a BLAST LAB?
BLAST will be used to analyze several genes and the information to construct a cladogram. A cladogram is also called a phylogenetic tree that shows a vision of the evolutionary relatedness between species.
To be able to do these Investigations, you would have to understand and build the cladogram, observe and analyze a fossil specimen, BLAST the fossil specimen and lastly, build your own genes of interest.
Investigation 1: Understanding a Cladogram
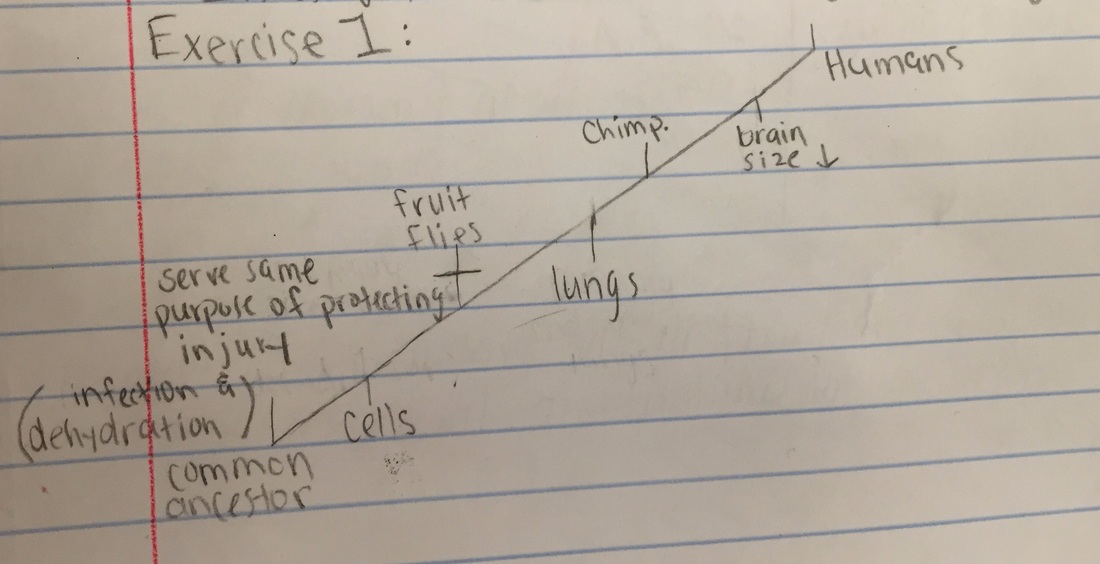
Exercise 1:
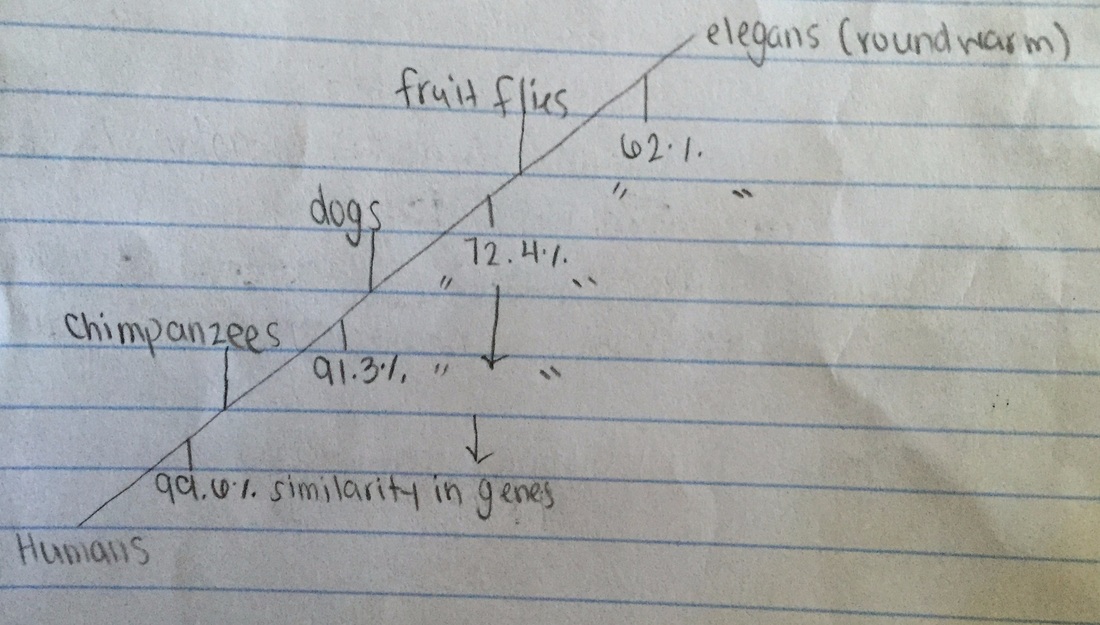
Chimpanzees and humans share 96% of their DNA which would place them closely on a cladogram. Humans and fruit flies are placed farther apart on a cladogram since they share only approximately 60% of their DNA.
Shown below is a cladogram that shows the evolutionary relationship be-
tween humans, chimpanzees, and fruit flies:
tween humans, chimpanzees, and fruit flies:
Exercise 2:
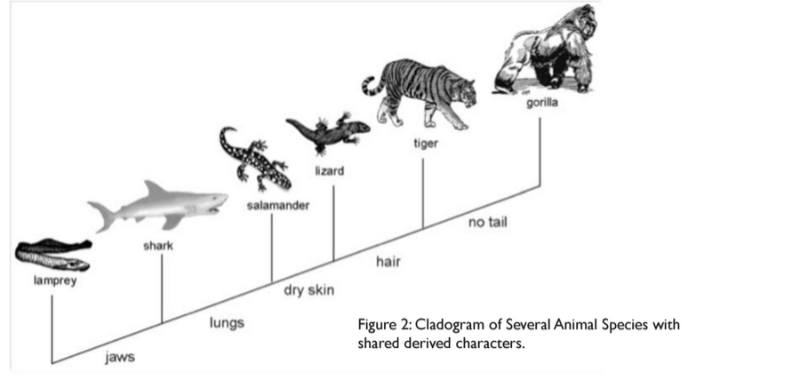
Using Figure 2 illustrated in the background information as your sample cladogram, answer the following questions:
|
Answers: 1. According to the cladogram, the only organisms that have hair are tigers and gorillas. 2. According to the cladogram the four structures that tigers possess are jaws, lungs, dry skin, and hair. 3. According to the cladogram, the structure that evolve first between lungs and dry skin are jaws. |
Investigation 2: Building Simple Cladograms
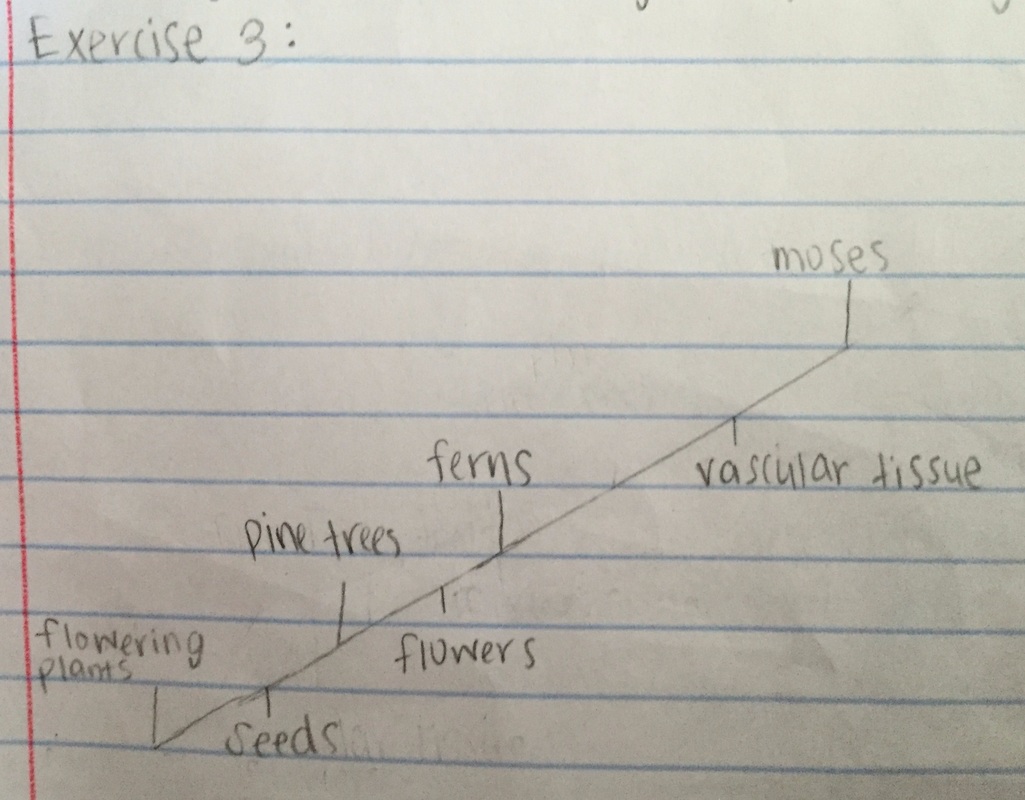
Exercise 3:
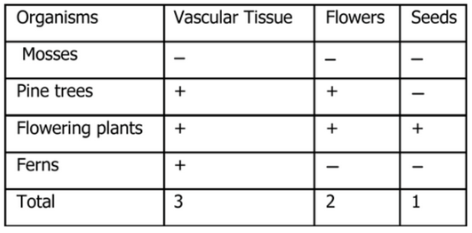
I used the following data to construct a cladogram of the major plant groups in the space provided below.
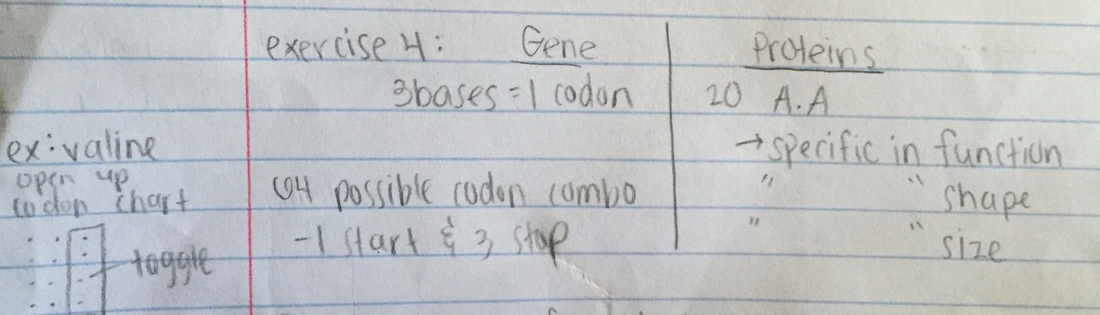
Exercise 4:
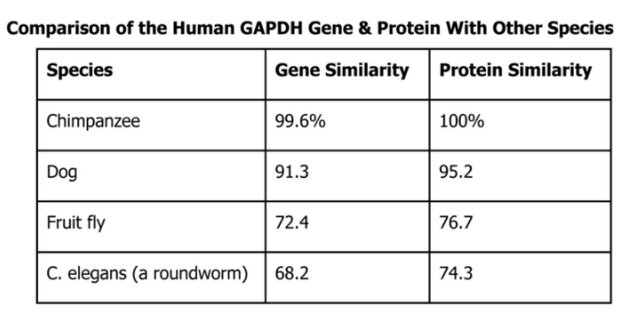
GAPDH (glyceraldehyde 3-phosphate dehydrogenase) is an enzyme that participates in glycolysis, an important reaction in the process of cellular respiration. The following table shows the percentage of similarity of this gene and the protein it expresses in humans versus other species.
What I know:
|
a) Question: Why is the percentage of similarity in the protein always higher than the percentage of similarity in the gene for each of the species?
|
Answer: The percentage of similarity in the protein is always higher than the percentage of similarity because in the genes for each species because there are multiple codons code for the same amino acids.
|
b) Below is a cladogram depicting the evolutionary relationships between all five species based on their percentage of similarity in the GAPDH gene.
Investigation 3: Undercovering Fossil Specimen Using BLAST
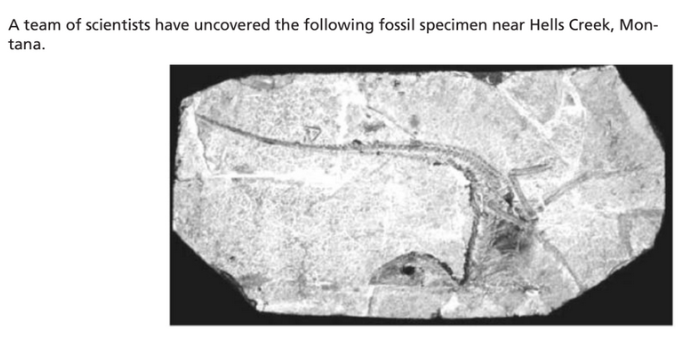
A. MORPHOLOGICAL OBSERVATION OF THE FOSSIL SPECIMEN AND FORMING THE HYPOTHESIS
Materials Used: chromebook, google drive, pencil, paper, phone, gene files, BLAST website
Procedures:
1. observe the morphology of the fossil
2. take your pencil or start typing down what you see
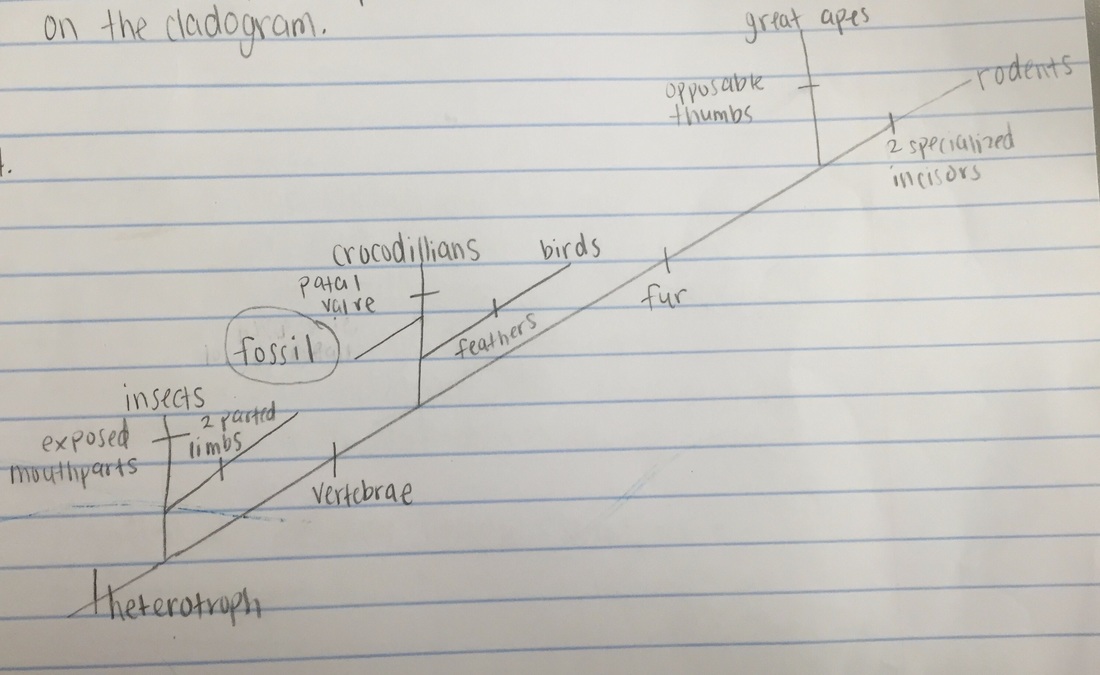
3. copy the cladogram in the diagram shown
4. form a hypothesis on where think the fossil should be located and why
5. now place the fossil in the cladogram where it belongs
6. take a picture and upload it onto google drive in order to upload it onto the BLAB.
(the remainding procedures will be on computer)
7. download files 1-4 genes from the website http://blogging4biology.edublogs.org/2010/08/28/college-board-lab-fi les/
8. to upload the gene sequence, Go to the BLAST homepage: http://blast.ncbi.nlm.nih.gov/Blast.cgi
9. Click on “Saved Strategies” on the top of the page.
10. Under “Upload Search Strategy,” click on “Browse” and locate one of the gene files you saved onto your computer.
11. Click "view".
12. A screen will appear with the parameters for your query already configured. Do not alter any of the parameters. Scroll down the page and click on the “BLAST” button at the bottom.
13. Repeat steps 2-6 for the rest of all 4 Genes.
14. After you have blasted all of the gene files, analyze each one of your genes.
15. Scroll down to the section titled, “Sequences producing signifi cant alignments”. The list of organisms that appear below this section are those with sequences identical to or most similar to the gene of interest. The most similar sequences are listed first and as you move down the list, the sequences become less similar to your gene of interest.
16. Click “Distance tree of results,” a cladogram of the species with similar sequences to your gene of interest placed on the cladogram will be shown according to how closely their matched gene aligns with your gene of interest.
17. Use the cladograms from each gene to compare other species with your desired gene and prove where the species belong in the cladogram.
18. Then, answer questions #1-4 from the lab.
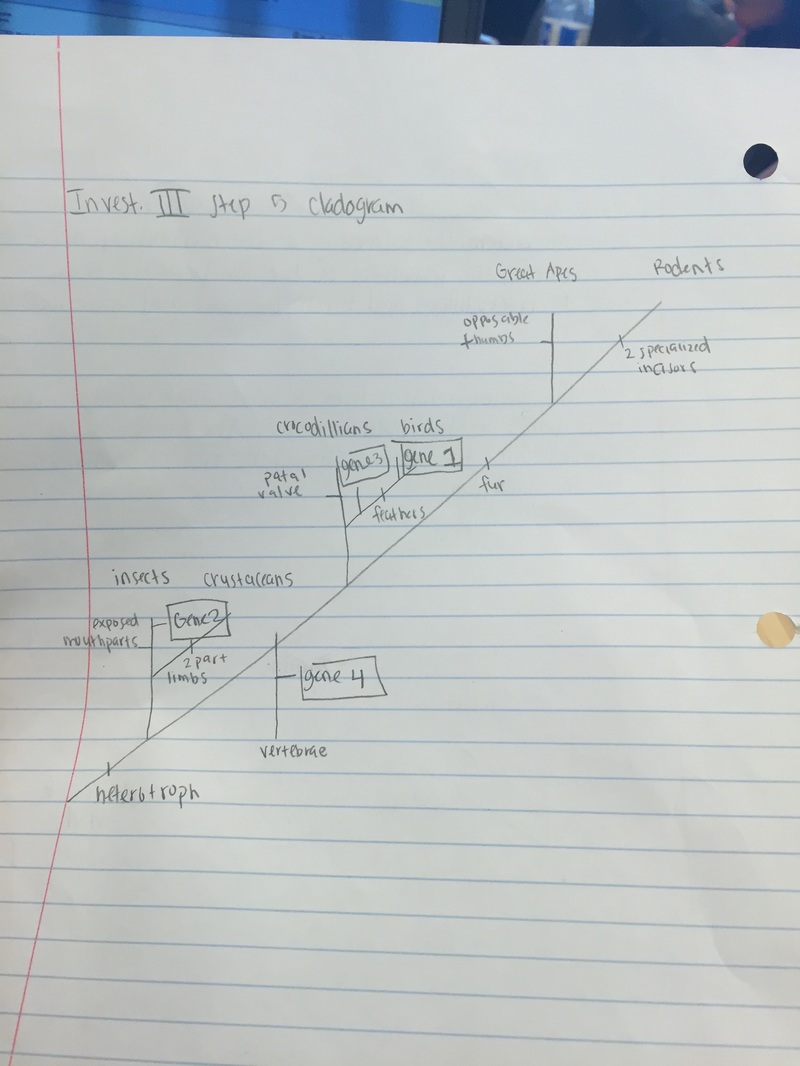
19. On the cladogram from investigation 3, include where genes 1-4 should be placed on the cladogram.
1. observe the morphology of the fossil
2. take your pencil or start typing down what you see
3. copy the cladogram in the diagram shown
4. form a hypothesis on where think the fossil should be located and why
5. now place the fossil in the cladogram where it belongs
6. take a picture and upload it onto google drive in order to upload it onto the BLAB.
(the remainding procedures will be on computer)
7. download files 1-4 genes from the website http://blogging4biology.edublogs.org/2010/08/28/college-board-lab-fi les/
8. to upload the gene sequence, Go to the BLAST homepage: http://blast.ncbi.nlm.nih.gov/Blast.cgi
9. Click on “Saved Strategies” on the top of the page.
10. Under “Upload Search Strategy,” click on “Browse” and locate one of the gene files you saved onto your computer.
11. Click "view".
12. A screen will appear with the parameters for your query already configured. Do not alter any of the parameters. Scroll down the page and click on the “BLAST” button at the bottom.
13. Repeat steps 2-6 for the rest of all 4 Genes.
14. After you have blasted all of the gene files, analyze each one of your genes.
15. Scroll down to the section titled, “Sequences producing signifi cant alignments”. The list of organisms that appear below this section are those with sequences identical to or most similar to the gene of interest. The most similar sequences are listed first and as you move down the list, the sequences become less similar to your gene of interest.
16. Click “Distance tree of results,” a cladogram of the species with similar sequences to your gene of interest placed on the cladogram will be shown according to how closely their matched gene aligns with your gene of interest.
17. Use the cladograms from each gene to compare other species with your desired gene and prove where the species belong in the cladogram.
18. Then, answer questions #1-4 from the lab.
19. On the cladogram from investigation 3, include where genes 1-4 should be placed on the cladogram.
Observations about the morphology (physical structure) of the fossil: Without making any assumptions on what the fossil specimen may be, I can see a tail, head, eyes, legs and or arm. It looks like a skeleton of some kind of creature with rough skin, dinosaur like. It also seems to have a vertebrae. The body seems bent and flipped to the opposite side of the head.
Little is known about the fossil other than it appears to be a new species. Upon careful examination of the fossil, small amounts of soft tissue have been discovered. The scientists were able to extract proteins from the tissue and use the information to sequence several genes.
I will use BLAST to analyze these genes and determine the most likely placement of the fossil species on the following fossil cladogram:
I will use BLAST to analyze these genes and determine the most likely placement of the fossil species on the following fossil cladogram:
Hypothesis: If the specimen has a form of a structure looking vertebrae based on the observation on the morphology, then the specimen should be near crocodillians.
(continuation of Investigation 3)
Questions:
1. What species has the most similar gene sequence as your gene of interest?
2. Where is that species located on the cladogram?
3. How similar is that gene sequence?
4. What species has the least similar gene sequence as your gene interest?
1. What species has the most similar gene sequence as your gene of interest?
2. Where is that species located on the cladogram?
3. How similar is that gene sequence?
4. What species has the least similar gene sequence as your gene interest?
Answers: Gene 1
1. Species that has most similar gene sequence: Gallus gallus collagen
2. location of specie: bottom of the cladogram, below birds
3. Similarity of that gene sequence: Struthio camelus australis collagen, type V, alpha 1 (COL5A1), transcript variant X1, mRNA (100%)
4. Least similar gene sequence: Haliaeetus albicilla collagen alpha-1(V) chain-like (LOC104325625), mRNA (28%)
Answers: Gene 2
1. Species that has most similar gene sequence: flies, 5 leaves
2. location of specie: bottom of the cladogram, located near flies and far away from ants
3. Similarity of that gene sequence: Drosophila melanogaster (92%)
4. Least similar gene sequence: D.melanogaster shaker gene, encoding a voltage-sensitive potassium channel, partial cds (26%)
Answers: Gene 3
1. Species that has most similar gene sequence: Taeniopygia guttata ubiquitin-conjugating enzyme E2Q family member 1
2. location of specie: bottom of the cladogram
3. Similarity of that gene sequence: Taeniopygia guttata ubiquitin-conjugating enzyme E2Q family member 1 (UBE2Q1), partial mRNA (92%
4. Least similar gene sequence: Phalacrocorax carbo ubiquitin-conjugating enzyme E2 Q1 (LOC104052279), partial mRNA (49%)
Answers: Gene 4
1. Species that has most similar gene sequence: Alligator
2. location of specie: bottom on cladogram near alligator and on vertebrae
3. Similarity of that gene sequence: Alligator (100%)
4. Least similar gene sequence: Emberiza cioides mitochondrion, complete genome (50%) and away from whales and dolphin on cladogram
Step 5: Drawing the Cladogram
Conclusion: The hypothesis was supported by the experiment because the observation help lead to the hypothesis. There could've been a possible source of error if I left anything out about the observation of the fossil. If we the hypothesis came before the observation, I think that could of been better because it's the process to the scientific method. Therefore if this would of been repeated, having the observation after the hypothesis could of work as well.
Investigation 4: BLAST Your Own Genes of Interest!
Materials Used: chromebook, google drive, BLAST website
Procedures:
1. To locate a gene, go to the Entrez Gene web-
site http://www.ncbi.nlm.nih.gov/gene and search for the gene. Once you have found the gene on the site, copy the gene sequence and input it into a BLAST query.
2. On the Entrez Gene website search the term “human actin”.
3. Click on the fi rst link that appears and scroll down to “NCBI Reference Sequences”.
4. Click on the fi rst fi le name “NM 001100.3” under “mRNA and Proteins”.
5. Click on “FASTA” just below the gene title.
6. The nucleotide sequence displayed is that of the actin gene in humans.
7. Copy the gene sequence and go to the BLAST homepage http://blast.ncbi.nlm.nih.gov/Blast.cgi
gov/Blast.cgi).
8. Click on “nucleotide blast” under the Basic BLAST menu.
9. Paste the sequence into the box where it says “Enter Query Sequence.”
10. Give the query a title in the box provided if you plan on saving it for later.
11. Under “Choose Search Set” select the type or genome you want to search (human
genome, mouse genome, or all genomes available).
12. Under “Program Selection” choose whether or not you want highly similar sequences
or somewhat similar sequences. Choosing somewhat similar sequences will provide you with more results.
13. Click BLAST.
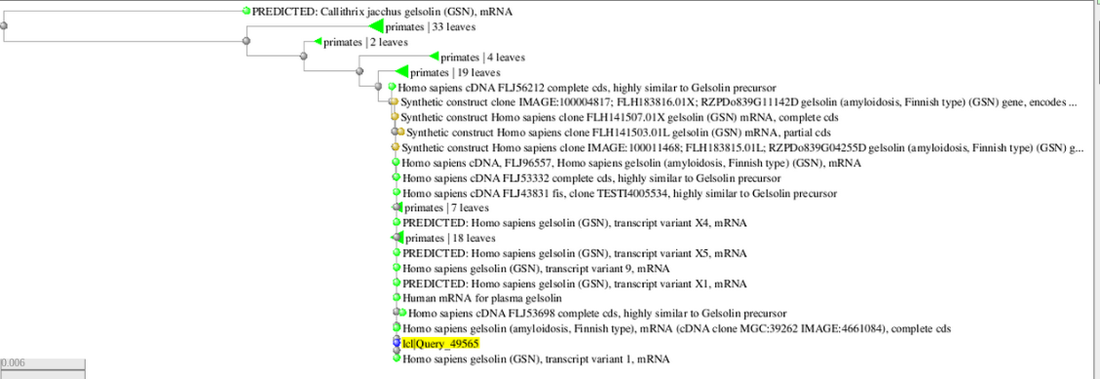
Gene Chosen: Homo sapiens Gelsolin (GSN)
Hypothesis: If humans have a common genome with primates then, then gelsolin will be similar in both species gene will be present for all organisms.